
Dissertation Example -A SYSTEMATIC APPROACH TO VERIFY AN EMBEDDED CAPACITIVE TOUCHSCREEN SYSTEM
A SYSTEMATIC APPROACH TO VERIFY
AN EMBEDDED CAPACITIVE TOUCHSCREEN SYSTEM
By
Jeffrey Lee Richardson
A thesis
submitted in partial fulfillment
of the requirements for the degree of
Master of Science in Computer Engineering
Boise State University
August 2013
© 2013
Jeffrey Lee Richardson
ALL RIGHTS RESERVED
BOISE STATE UNIVERSITY GRADUATE COLLEGE
DEFENSE COMMITTEE AND FINAL READING APPROVALS
of the thesis submitted by
Jeffrey Lee Richardson
Thesis Title: A Systematic Approach to Verify an Embedded Capacitive Touchscreen System
Date of Final Oral Examination: 18 June 2013
The following individuals read and discussed the thesis submitted by student Jeffrey Lee Richardson, and they evaluated his presentation and response to questions during the final oral examination. They found that the student passed the final oral examination.
Sin Ming Loo, Ph.D. Chair, Supervisory Committee
Hao Chen, Ph.D. Member, Supervisory Committee
Jennifer Smith, Ph.D. Member, Supervisory Committee
The final reading approval of the thesis was granted by Sin Ming Loo, Ph.D., Chair of the Supervisory Committee. The thesis was approved for the Graduate College by John R. Pelton, Ph.D., Dean of the Graduate College.
To
Sarah
Samuel, Carter, and Logan
Dad and Bruce
ACKNOWLEDGEMENTS
I am grateful for this opportunity to thank the people that have helped me through this process. First, I express my thanks to my advisor, Dr. Sin Ming Loo, for his patience with me and the advice he has given me over the years. I thank Elizabeth Weese for her time and willingness to read through my thesis multiple times and make necessary edits and corrections to my sentence structure and grammar. I thank Todd Schwoewer, Ryan Seguine, Eric Blom, Tomasz Cewe, and Aaron Gordon for reviewing my thesis at different stages along the way and giving excellent advice. I thank Erik Anderson, Patrick Prendergast, Blake Gilfillan, and Jacob Tomy for their ideas and expertise. I thank Marcin Lobrow, Erik Anderson, and Jenny Bui for letting me use some of their graphics. I thank Greg Lupion for his feedback on my writing. I also give a special thanks to Jenny Bui and Ian Smith for their implementation of the custom-built test management software.
Finally, I thank my wife, Sarah, for her patience and all of the very long hours she has dedicated to allowing me to finish this work. Words cannot express the love and gratitude I have for her. I express my thanks and love to our three boys: Samuel, Carter, and Logan who have been patient with me and have missed out on many (not all) fishing and camping trips. I give my love and special thanks to the rest of my and my wife‟s family who have been a tremendous support and excellent examples of hard work and determination throughout my life; especially, my mother. Thank you.
ABSTRACT
The conspicuously massive growth in the number of products utilizing capacitive touchscreen technology has raised awareness of the technology. The embedded system used to detect and report finger touches to the host is fairly complex and difficult to verify. An automated verification system is required to systematically test this type of system in a reasonable amount of time. This thesis describes the framework for an automated verification system for embedded capacitive touchscreen systems. The framework includes a Cartesian desktop robot, test instruments, communications bridge, and custom-built test management software. The criteria for selecting a Cartesian desktop robot rather than a SCARA robot are discussed. The SCARA robot provides quicker but less precise movements, while the Cartesian desktop robot supports a larger payload and accommodates more touchscreen panels in its work envelope. The criteria for choosing to develop custom-built test management software instead of purchasing existing off-the shelf test management are also discussed. Both solutions support hardware abstraction, verification procedures, procedure sequencing, and output of the results. The custom built solution is more flexible, providing access to how the software framework is implemented and allowing adjustments as needed. Off-the-shelf solutions are limited in what customizations they support and often have unnecessary features that utilize valuable computing resources.
TABLE OF CONTENTS
ACKNOWLEDGEMENTS …………………………………………………………………………………………
ABSTRACT ……………………………………………………………………………………………………………..
LIST OF TABLES ……………………………………………………………………………………………………..
LIST OF FIGURES …………………………………………………………………………………………………..
LIST OF ABBREVIATIONS ……………………………………………………………………………………
CHAPTER ONE: INTRODUCTION ……………………………………………………………………………
1.1 Mobile Computing Systems …………………………………………………………………………
1.2 Capacitive vs. Resistive Touchscreens ………………………………………………………….
1.3 Capacitive Touchscreen Trend …………………………………………………………………….
1.4 Verification ……………………………………………………………………………………………….
1.4.1 Capacitive Touchscreen …………………………………………………………………
1.4.2 Repeatability ………………………………………………………………………………..
1.5 Verification Automation ……………………………………………………………………………..
1.6 Thesis ……………………………………………………………………………………………………….
1.7 Overview …………………………………………………………………………………………………..
CHAPTER TWO: PREVIOUS WORK AND EXISTING TECHNOLOGY ……………………..
2.1 Previous Research ………………………………………………………………………………………
2.2 Existing Technology …………………………………………………………………………………
2.2.1 Test Stand Test Management Software …………………………………………..
2.2.2 SCARA Robot ……………………………………………………………………………
CHAPTER THREE: SYSTEM VERIFICATION AUTOMATION ARCHITECTURE ……
3.1 Overall System Architecture ………………………………………………………………………
3.2 System Under Verification ………………………………………………………………………..
3.2.1 Touchscreen Controller Board ………………………………………………………
3.2.2 Touchscreen Sensor Panel ……………………………………………………………
3.3 Verification Equipment ……………………………………………………………………………..
3.4 Test Management Software ……………………………………………………………………….
CHAPTER FOUR: SYSTEM VERIFICATION HARDWARE ……………………………………..
4.1 Hardware Under Verification …………………………………………………………………….
4.1.1 Touchscreen Sensor Panel ……………………………………………………………
4.1.2 Touchscreen Micro controller ………………………………………………………..
4.2 Hardware Utilized for Verification ……………………………………………………………..
4.2.1 USB Communications Bridge……………………………………………………….
4.2.2 Cartesian Robot …………………………………………………………………………..
CHAPTER FIVE: VERIFICATION SOFTWARE ……………………………………………………….
5.1 Software Architecture ……………………………………………………………………………….
5.2 Automated Test Engine ……………………………………………………………………………..
5.2.1 Hardware Abstraction ………………………………………………………………….
5.2.2 Procedures ………………………………………………………………………………….
5.2.3 Sequencer …………………………………………………………………………………..
5.3 Data Collector ………………………………………………………………………………………….
5.3.1 Data Object ………………………………………………………………………………..
5.4 Data Processor …………………………………………………………………………………………
5.5 Report Generator ………………………………………………………………………………………
5.5.1 Report Object ……………………………………………………………………………..
5.5.2 Document Generation ………………………………………………………………….
5.6 Output …………………………………………………………………………………………………….
CHAPTER SIX: CAPACITIVE TOUCHSCREEN VERIFICATION AUTOMATION ……
6.1 Automating SNR Verification ……………………………………………………………………
6.2 Automating Report Rate Verification ………………………………………………………….
6.3 Automating Linearity Verification ……………………………………………………………..
6.4 Automating Accuracy Verification ……………………………………………………………..
6.5 Automating Jitter Verification ……………………………………………………………………
CHAPTER SEVEN: CONCLUSIONS ……………………………………………………………………….
7.1 Robot ………………………………………………………………………………………………………
7.2 Test Management Software ……………………………………………………………………….
CHAPTER EIGHT: FUTURE WORK ……………………………………………………………………….
8.1 Robot Touch Objects ………………………………………………………………………………..
8.2 Test Management Report Generation ………………………………………………………….
8.3 Test Management Software Database Support ……………………………………………..
8.4 Human Experience ……………………………………………………………………………………
REFERENCES ………………………………………………………………………………………………………..
LIST OF TABLES
Table 1. Refresh Rate Measurement ………………………………………………………………………
Table 2. Linearity Deviation Measurement …………………………………………………………….
Table 3. Accuracy Error Measurement …………………………………………………………………..
Table 4. Jitter X and Y Measurement …………………………………………………………………….
LIST OF FIGURES
Figure 1. Automation Verification System ……………………………………………………………….
Figure 2. SCARA Robot Kinematic Diagram [43] …………………………………………………..
Figure 3. SCARA Work Envelope 2D [42] …………………………………………………………….
Figure 4. SCARA Work Envelope 3D [41] …………………………………………………………….
Figure 5. System Architecture [36] [37] [38] [39] [40] …………………………………………….
Figure 6. Projected Capacitive Touchscreen Sensor Panel Layers ……………………………..
Figure 7. Ghost Effect in Self-Capacitive Sensing …………………………………………………..
Figure 8. Mutual Capacitive Sensing ……………………………………………………………………..
Figure 9. Detecting Multiple Touches in Mutual Capacitance Sensing ………………………
Figure 10. Cartesian Robot Kinematic Diagram [35] ……………………………………………….
Figure 11. Cartesian Robot Work Envelope [34] …………………………………………………….
Figure 12. Test Management Software Architecture ………………………………………………..
Figure 13. Test Case Structure ………………………………………………………………………………
Figure 14. TRD Test Case Example ………………………………………………………………………
Figure 15. Sequencer Flow …………………………………………………………………………………..
Figure 16. Linearity Type of Data Processing …………………………………………………………
Figure 17. SNR Measurements – Bar Graph …………………………………………………………..
Figure 18. SNR Measurement – Heat Map ……………………………………………………………..
Figure 19. Low Refresh Rate ………………………………………………………………………………..
Figure 20. High Refresh Rate ……………………………………………………………………………….
Figure 21. Linearity …………………………………………………………………………………………….
Figure 22. Linearity Measurement Plots …………………………………………………………………
Figure 23. Accuracy (ACC) ………………………………………………………………………………….
Figure 24. Accuracy Measurement Plot and Histograms ………………………………………….
Figure 25. Jitter …………………………………………………………………………………………………..
Figure 26. Jitter Measurement Bar Graphs ……………………………………………………………..
LIST OF ABBREVIATIONS
DO ActiveX Data Objects
ADC Analog-to-Digital Converter
API Application Programming Interface
ASCII American Standard Code for Information Interchange
ATML Automatic Test Markup Language
COM Component Object Model
DOC Microsoft Word Document
DMM Digital Multimeter
FPC Flexible Printed Circuit
HTML Hyper Text Markup Language
I/O Input / Output
I2C Inter-Integrated Circuit
ITO Indium Tin Oxide
IVI Interchangeable Virtual Instruments
LCD Liquid Crystal Display
OCA Optically Clear Adhesive
ODBC Open Database Connectivity
PCB Printed Circuit Board
PDF Portable Document Format
PET Polyethylene terephthalate
PMMA Poly(methyl methacrylate)
RS-232 Recommended Standard 232
SCARA Selective Compliant Articulated Robot Arm
SMPS Switched-Mode Powered Supply
SNR Signal-to-Noise Ratio
SPI Serial Peripheral Interface
TRD Test Requirements Document
USB Universal Serial Bus
VISA Virtual Instrument Software Architecture
VME VERS A module Eurocard bus
VXI VME Extensions for Instrumentation
XML Extensible Markup Language
CHAPTER ONE: INTRODUCTION
1.1 Mobile Computing Systems
The concept of mobile computing systems has been around since the “Dynabook” was conceived in 1968 [1]. When the Xerox Alto (a.k.a. “interim Dynabook”) [2] and IBM‟s Special Computer, APL Machine Portable (SCAMP), were created in 1973 [3][4], mobile computing systems became a reality. Since then, mobile computing systems have become slimmer and smaller with multiple core CPUs and high-capacity memory. Resistive and capacitive touchscreens enable mobile computing systems that weren‟t even imaginable in the 1960‟s, such as tablets, mobile phones, and GPS units. These systems eliminate the need for keyboards and mice, and demand for these systems is increasing. As the systems have become smaller, they are often referred to as devices. Touchscreen sensors play a big part in the user interface of today‟s mobile devices. Touch interfaces have a modern aesthetic and provide users with an easy and intuitive way of using the device. Touchscreens dominate mobile phone interfaces. In addition to making phone calls, they allow the user to text, play games, take pictures and video, browse the internet, and navigate all on the same mobile device. In addition, touch sensors give users easy access to hundreds of thousands of apps, providing additional resources.
The increase in production of the materials used to manufacture touchscreens clearly demonstrates how this technology has taken off. Production grew 66% from 5.8 million square meters produced in 2010 to 9.6 million square meters produced in 2011. 2 Growth is expected to reach 16.4 million square meters by 2014. The resulting numbers include both capacitive and resistive touchscreens [5].
1.2 Capacitive vs. Resistive Touchscreens
Resistive touchscreens were widely used until recently. Resistive touchscreens are comprised of two conductive layers. A finger touch is detected when the user pushes on the screen making the layers contact one another. Resistive touchscreens are more cost effective than capacitive touchscreens because they only require four to eight wires to interface with the system. However, they provide a less desirable user experience because
they require users to touch with enough force to connect the two layers.
There are several advantages capacitive touchscreens have over resistive touchscreens. Capacitive touchscreens do not require any actuation force from a finger or object [28]. They provide a more transparent screen because the material does not have to be flexible, and a more durable screen because they can support a hard layer of safety glass on the surface. Resistive touchscreens only transmit about 75% of the display luminance [29]. Capacitive touchscreens allow multiple simultaneous touches.
1.3 Capacitive Touchscreen Trend
As the materials used to manufacture capacitive touchscreens have become more transparent and less expensive, they have become increasingly popular in mobile computing systems. Moreover, users adapt quickly and easily to the light touch allowed with capacitive touchscreens as compared to the forceful touch or stylus required to use resistive touchscreens. In 2010, the supply of resistive touchscreens exceeded demand. Some resistive touchscreen manufacturers are retooling to produce capacitive 3 touchscreens. The number of capacitive touchscreen manufacturers grew from 27 in 2009 to more than 80 in 2011[5].
The increase in demand for products with capacitive touchscreens has stoked competition and the drive to get the next best device to market. The reality of shorter product cycles with dramatically reduced time-to-market can lead to major mistakes, loss of revenue, and distrust of the product among users. This means that users may be more likely to choose a different product or manufacturer in future purchases. Therefore, it‟s important to trace the roots of these mistakes. These issues often stem from holes in system validation and verification. It is crucial that all intrinsic design defects are discovered well before a product is release to the market. As capacitive touchscreens are experiencing increased demand and decreased development time simultaneously, this thesis will focus on how to efficiently and systematically verify an embedded capacitive touchscreen system.
1.4 Verification
The focus of this thesis is verification rather than validation. Verification is absolutely critical to the long-term success of any system. Validation is defined as evaluating the system throughout the development process to ensure that the right system is being built. Verification uses the planned requirements and specifications to evaluate the system throughout the development process and ensure the system is both designed and built correctly. The cost to verify systems depend greatly on the complexity of the system.
1.4.1 Capacitive Touchscreen
Embedded capacitive touchscreen systems consist of two major pieces: the capacitive touch sensor and the microcontroller. The capacitive touch sensor requires touch stimulation to evaluate the system‟s performance versus its specification. The micro controller interfaces with the sensor to detect touches, gather data, calculate data for each touch, and report it to the host. Factors such as power will be described later, along with additional details on each piece of the system. Verifying a capacitive touchscreen system can be challenging when you consider that there are an infinite number of ways to move a finger across a touchscreen.
1.4.2 Repeatability
Every human finger is different and, by nature, it is easy for humans to misinterpret clearly written verification procedures. For example, there are multiple ways to interpret what it means to “go from the top left corner of the screen to the bottom right corner.” When verifying a specific requirement, it is absolutely necessary to verify it the same way every time even if a different person is verifying it. Otherwise, different results could be generated, causing confusion and adding additional time to the process. Using a robot in conjunction with conductive touch objects as much as possible during verification eliminates the problems caused by finger-to-finger variation and misinterpretation. Automated verification procedures become necessary when using a robot with conductive touch objects because the cost of manually operating the robot is very significant. The verification procedures will be run hundreds of times over a year, and automating the procedure is more economical and provides repeatability.
1.5 Verification Automation
An automated verification system consists of five major pieces (Figure 1): PC, robot, touchscreen controller board, touchscreen panel, and verification equipment.
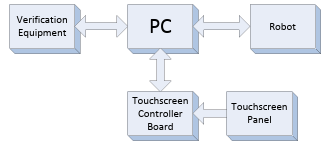
The PC communicates with the robot, touchscreen controller board, and the verification equipment using test management software. The software is written to enable communication with the robot, touchscreen controller via the firmware, and the verification equipment. Further details about each of these items and the overall architecture will be described later.
1.6 Thesis
There are many ways to solve the problem of systematically verifying an embedded touchscreen system. There have been testing methodologies introduced in previous work that is applied to this work. This thesis places extra emphasis on an automation framework supporting hardware abstraction, verification procedures, test sequences, and output of the results. Using test management software and a robot is a highly successful and cost-effective solution for the verification automation system. This thesis will begin by discussing an existing solution that uses a Selective Compliant 6 Articulated Robot Arm (SCARA) type robot and off-the-shelf test management software.
This thesis will then introduce a lower cost, more flexible solution that uses a Cartesian type robot with a custom-built test management software. The robots in both solutions are similar in cost; however, there are some distinct advantages of using a Cartesian type robot. The solution described in this thesis is fully operational and running on a daily basis. Certain details of the system, such as code snippets and system pictures, were intentionally omitted due to proprietary rights.
1.7 Overview
This thesis will describe two automated verification systems: an off-the-shelf solution that exists today and a solution that employs a Cartesian type robot and a custom-built test management software. Chapter 2 presents the previous research done on automation verification systems. It also describes the off-the-shelf solution that utilizes a SCARA robot and the TestStand test management software from National Instruments. Chapter 3 introduces the system being verified, the verification equipment, and the custom-built test management software. Chapter 3 also describes the overall architecture including all system layers from the touchscreen panel and test equipment to the PC software. Chapter 4 discusses the hardware being verified including the touchscreen panel, microcontroller, system power, system communications, and data storage. Chapter 4 also discusses the hardware utilized for verification including the PC communications bridge and the Cartesian robot. Chapter 5 provides details of the test management software solution when considering the needs for support of hardware abstraction, sequences, procedures, and output. Chapter 6 explains the types of verification performed
via the test management software in conjunction with the robot. Chapters 7 and 8 present conclusions and future work respectively.
CHAPTER TWO: PREVIOUS WORK AND EXISTING TECHNOLOGY
2.1 Previous Research
Because manually verifying touchscreens is prohibitively expensive, automated verification systems have been gaining attention. The focus on these systems has increased over the years as technology has improved and automation resources have increased. A couple of areas of research are directly related to the test management software and verification methodologies. Li and Wu‟s book on developing an automated testing tool focuses on the process of creating custom-built test management software [15]. The book‟s software oriented focus means that it does not provide some of the hardware interfacing required by the system developed in this thesis. It does however point out some salient disadvantages of using an off-the-shelf solution. Excessive time and cost can be required to compare all available products. Vendors often make unrealistic test coverage claims because they fail to consider rapid advancements in technology and company trade secrets that may require special tool enhancements.
An off-the-shelf solution will never deliver a complete package; there is always going to be test procedure development. The verification test process must be solidified before moving forward with the test automation architecture and implementation. Mette and Hass proposed a generic test process that emphasizes the importance of test planning, design, development, execution (including execution sequence), and reporting [17]. Although their work is not directly related to automation, their process covers the essential pieces for automation and the functions needed in the test management software in this thesis.
In the International Journal of Software Engineering and Its Applications, Lim et al. presented a test framework for robot components consisting of four parts: test data
generation, test manager, test execution, and test monitoring [16]. Test data generation is not required for this thesis; however, the other three are necessary and map to the test engine work presented in Chapter 5. The article did not focus on test results output, which is important for system analysis. Coffman‟s thesis introduced a test automation framework for a system containing both hardware and software. This work was done over fifteen years ago and emphasized test procedure sequencing [18]. The work also discussed automating test results output and interfacing with external hardware including test equipment. Given the many advances in software and hardware abstraction since it was published, this thesis provides advanced test results reporting and provides an example of how hardware abstraction is not as difficult to accomplish.
Other work has focused on test results and test sequencing. He‟s article proposed an embedded system modular approach [24]. While Jovalekic and Rist‟s work involved distributed embedded systems and provided more details on how to generate a test plan for this type of system [25]. Work related to using National Instruments‟ (NI) LabView and external test equipment for automation was also important for the work presented in this thesis [26][27]. The authors did not utilize NI‟s TestStand™ as it had been used in previous work [8]. NI‟s TestStand is described in the next section.
2.2 Existing Technology
A common way to deploy an automated verification system is to use off-the-shelf technology. NI‟s TestStand test management software is widely used by the industry and comes ready to use. A SCARA type robot provides the work envelope, repeatability, and speed necessary to ensure the touchscreen verification process is repeatable and robust.
2.2.1 Test Stand Test Management Software
The sole responsibility of the test management software is to automate the verification process. The software achieves this goal with providing support for the four areas of focus that have discussed in the previous work mentioned: hardware abstraction, verification procedures, test sequences, and output of the results. Test Stand provides all of these main functions. NI lists the following supported features: Hardware Support (hardware abstraction), Test Execution (verification procedures), Sequence Development (test sequences), and Report/Result Management (output of the results) [6]. These features are standard across other test management software solutions. To deploy TestStand in a verification system, the test designer must become familiar with the software, configure it, and set it up to work with the specific verification equipment, robot, and controller board.
2.2.1.1 Hardware Support
Instruments are essential for verifying any type of embedded system. Hardware abstraction denotes the ability to virtually control instruments. TestStand handles abstraction with Interchangeable Virtual Instruments (IVI) standard instrument drivers [7]. IVI supports eight classes of instruments: digital multimeter (DMM), oscilloscope, arbitrary waveform generator, DC power supply, AC power supply, switch, power meter, spectrum analyzer, and RF signal generator. IVI supports communication with instruments that utilize Serial, Ethernet, USB, GPIB, VXI, and PXI, in conjunction with the VISA I/O standard library. Instrument specific APIs are available for the verification procedures. This enables automated instrument control in the verification system hardware setup.
Test Stand does not come with hardware support for specific robots. The robot manufacturer can provide the required driver. Test Stand can then use the robot‟s driver via IVI.
2.2.1.2 Test Execution
Test execution describes the process of running a verification procedure in a test sequence. Although Test Stand is described as an off-the-shelf solution, the verification procedures have to be customized, or developed, for their intended purpose. Multiple verification procedures are required for an embedded touchscreen system. Each
verification procedure needs to provide the following: inclusion of libraries (for test instruments), stimulus, execution of or routing tasks, expected result, and actual result (either by making measurements or interfacing with hardware). An example verification procedure for a touchscreen verification system would instruct the robot to pick a finger and check the linearity of the touch reports as the finger is moved across the sensor. Each verification procedure can have different input parameters such as movement direction, finger size, and movement speed. Each verification procedure is run from within Test Stand via a sequence file.
Verification procedures for Test Stand can be written in any programming language. LabView is one of the most common languages used with Test Stand.
2.2.1.3 Sequence Development
The order in which the verification procedures are run is defined in the test sequence. You develop the test sequence using TestStand‟s Sequence Editor. The test sequence contains one or more step types that appear in the order in which they should be run. Each step calls a verification procedure or code module. The test sequence is where test limits and conditions are set. Each step is configured individually. Test Stand comes with a set of predefined test steps as well as allowing you to create custom test steps. Test Stand supports conditional step types including: Action, Sequence Call, Statement, Call Executable, Limit Loader, Flow Control, Database, Synchronization, and IVI. The remaining step types call test modules that return actual test results. These include Pass/Fail Test, Numeric Limit Test, Multiple Numeric Test, and String Value Tests.
2.2.1.4 Reporting/Results Management
Verification procedures are meaningless without their corresponding results. Test Stand‟s reporting structure displays all of the results from each test module in the test sequence. Report format options include: ASCII Text, HTML, XML, and ATML [8]. You can configure the report title, location, and content for each individual test sequence and/or test station. Reports can be generated “on-the-fly” (after each step in the test sequence) or after the full test sequence is completed.
Results can be stored in a database. TestStand supports ADO and ODBC compliant databases including: MySQL, SQL Server, Access, Oracle, and Sybase. It utilizes the API that comes with ADO and ODBC, enabling you to store your test results in the database without knowing how the database is implemented.
2.2.2 SCARA Robot
There are numerous types of robots to choose from when designing an automated test system. A robot that is used for assembly is a good choice since touchscreen verification requires similar movements. The SCARA type of robot is capable of making movements similar to humans. This enables a more intuitive approach to automating a verification procedure that mimics how a human would move. Two articulated arms enable X and Y axis movement similar to that of a human arm as shown in the kinematic diagram (Figure 2). Z axis movement is similar to a Cartesian type of robot and is completely linear as represented with the rectangular prism. The X and Y axis of a SCARA robot creates a circular work envelope and is dependent on the rotational reach as represented with the cylindrical shapes. SCARA robot manufacturers typically provide a driver that automatically translates polar to linear coordinates. This makes it easier to use the robot with the linear characteristics of a touchscreen. There are many manufacturers of SCARA robots appropriate for this type of use.
![Figure 2. SCARA Robot Kinematic Diagram [43]](https://break-addiction.co.uk/wp-content/uploads/2024/03/figure-2.png)
2.2.2.1 Work Envelope
The work envelope defines the space in which a robot is capable of moving. The work envelope needs to be of primary concern when selecting a robot. The arm will need to extend fully across the touchscreen panel. Figure 3 shows a typical work envelope of a SCARA robot. A three dimensional view of the work envelope is shown in Figure 4.
![Figure 3. SCARA Work Envelope 2D [42] Figure 4. SCARA Work Envelope 3D [41]](https://break-addiction.co.uk/wp-content/uploads/2024/03/figure-3.png)
The work envelope of a SCARA robot with an arm reach of approximately 400 mm is large enough to reach more than one 4.7” touchscreen panel in at a time. However, more than one touchscreen (Panels A, B and C) will not be aligned in order to fit inside the work envelope as shown in Figure 3. The Z space will need to be about 100 mm, depending on the type of tools used in the robot arm.
2.2.2.2 Repeatability and Speed
The positioning repeatability of SCARA type robots ranges from ±0.01 mm to ±0.025 mm. Robots that support higher payloads not only have a higher price tag, but they also have greater repeatability error (closer to ±0.025 mm). As noted earlier, repeatability is critical to verification automation. The speed of the robot is another important factor. This is especially important if high-speed testing is necessary in the automated verification system. SCARA type robots are capable of moving at speeds of about 3,000 mm/s along the X and Y axis, and 1,000 mm/sec along the Z axis. Acceleration from a complete stop to maximum speed is an important characteristic to consider. In order to reach maximum speed while touching the panel, the robot will need to move on one edge of the work envelope and accelerate to the maximum speed. As it reaches the panels‟ edge, it can be lowered down while maintaining its speed and swipe across the panel.
2.2.2.3 Payload
The robot‟s payload includes the metal touch object used to stimulate the touchscreen panel and anything else attached or used to hold the object in place. SCARA type robots are somewhat limited in their payload capacity. Typical SCARA type robots are rated for 1 Kg of payload and can have a maximum payload of about 3 Kg. Some SCARA type robots are rated for a 5 Kg payload, however, they can cost up to 1/3 more.
2.2.2.4 Cost
SCARA type robots for this type of application cost about $17,000 – 18,000. The price can increase to $30,000 for robots with longer arms and larger payload ratings. Robots with longer arms and higher payload rating have lower repeatability.
CHAPTER THREE: SYSTEM VERIFICATION AUTOMATION ARCHITECTURE
3.1 Overall System Architecture
There are many system architectures that can automate embedded touchscreen system verification. The architecture presented in this work allows the flexibility of using different touchscreen controller boards and sensor modules in order to compare verification results. Figure 5 shows the overall architecture of the automated verification system.
![Figure 5. System Architecture [36] [37] [38] [39] [40]](https://break-addiction.co.uk/wp-content/uploads/2024/03/figure-5.png)
There are several components in this system architecture. The Cartesian robot is controlled by the host PC and moves the touch object that stimulates the touchscreen sensor panel. The data generated by the touchscreen controller board is transmitted to the host PC via the USB communications bridge. The test equipment is controlled by the host PC and may be connected to the touch object to provide additional stimulus as well as to the touchscreen controller board to collect data.
3.2 System Under Verification
The system under verification includes the touchscreen controller board and its associated firmware and the touchscreen panel. These components make up the embedded system or subsystem that is integrated into the end product (e.g., phone, GPS, or MP3 player).
3.2.1 Touchscreen Controller Board
In typical applications, the touchscreen micro controller is mounted on a flexible printed circuit (FPC) that is connected to the touchscreen sensor panel. For development and verification purposes, the touchscreen micro controller is populated on a printed circuit board (PCB) that is laid out according to datasheet specifications. The PCB has a mounted connector for the FPC of the touchscreen sensor panel, which connects all of the pins from the sensor panel to the touchscreen micro controller I/O pins. The touchscreen controller board also includes an I2C and SPI connector for communicating with the host PC via the USB communications bridge.
The populated PCB comes from the touchscreen micro controller manufacturer in a development kit. It is important to consider that the touch micro controller silicon has been through the silicon validation and verification processes from the manufacturer. Hence, only system-level verification is needed. Details of the touchscreen micro controller will be explained in the next chapter.
3.2.2 Touchscreen Sensor Panel
The touchscreen sensor panel includes an FPC for connecting to the touchscreen controller board. They typically come from the manufacturer with each electrode tested for opens and shorts. It is very likely that the sensor panels are delicate when they are outside of an enclosed system and can be easily damaged after handling, which may be found during verification. Further details about the touchscreen sensor panel are provided in the next chapter.
3.3 Verification Equipment
Verifying an embedded touchscreen system requires the following: a PC, a Cartesian desktop robot, a touch object attached to the robot, a USB communications bridge, and other test equipment. The PC includes the ports and drivers necessary to communicate with all of the equipment. USB ports connect to a USB communications
bridge as well as test equipment. An RS-232 (serial) port communicates with the robot. The USB communications bridge and associated driver come with the touchscreen micro controller development kit. In a typical consumer product, the touchscreen micro controller communicates to the embedded system host via I2C or SPI. Therefore, the USB communications bridge is connected to the touchscreen controller board via the I2C and/or SPI connector.
The robot is a Cartesian desktop robot. The touchscreen controller board, USB communications bridge, and touchscreen sensor panel are connected and securely fastened to the robot‟s platform of the robot. A USB cable is connected between the PC and the USB communications bridge. The cable is long enough to allow the robot to make all of the necessary movements and is secured. The robot holds the touch object that stimulates the touchscreen sensor panel. The other test equipment includes an arbitrary waveform generator, oscilloscope, and DMM. Additional touchscreen sensor panel stimulation is achieved by connecting the arbitrary waveform generator to the touch object. The oscilloscope is used to measure the refresh rate. The DMM is used to record voltages and currents.
3.4 Test Management Software
The custom-built test management software enables complete automation of the verification test process. Similar to NI‟s Test Stand, the test management software provides the ability to abstract the hardware, setup test sequences, execute specific verification procedures, and provide sufficient reports documenting the results of all tests run in a particular sequence. The custom-built test management software was created using a common programming language. It could be developed in many different languages. Some commonly used languages that would work well for this type of application include: C#, C++, Python, and Perl. Because these programming languages have existed for well over ten years, they have an abundant supply of supporting documentation and reference material. In addition, there are many open source packages available to ease software development. Further details on the custom-built test management software are provided in Chapter 5.
CHAPTER FOUR: SYSTEM VERIFICATION HARDWARE
4.1 Hardware Under Verification
The hardware being verified is an embedded touchscreen system. This system includes a projected capacitive touchscreen sensor panel and a touchscreen micro controller.
4.1.1 Touchscreen Sensor Panel
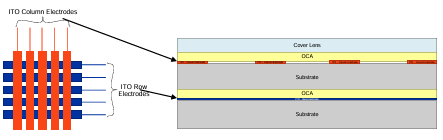
Touchscreen sensor panels are made up of multiple layers of material as shown in Figure 6. The type of touchscreen sensor panels used for this research are projected capacitance. In these types of panels, the sensing materials are arranged in rows and columns of electrodes. The conductive materials are optically transparent so that they can be placed over LCDs. The most common conductive material used for projected capacitive touchscreens is Indium Tin Oxide (ITO) [9]. Studies have been done to find an alternative material such as carbon nanotubes for the conductive layers [30] [31]. The panels used for this research have ITO applied as a film on each side of a substrate material such as glass, poly(ethylene terephthalate) (PET), or poly(methyl methacrylate) (PMMA) [10]. The ITO substrate layers are attached to each other and the cover lens with an optically clear adhesive (OCA). The assembled layers have an accumulated transparency greater than 90%.
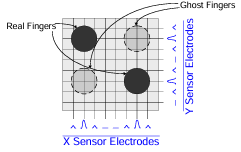
There are two types of projected capacitive touchscreen sensor panels: self capacitive and mutual capacitive. Self-capacitive touchscreens use all rows and column electrodes as sensors. The sensors are scanned individually to detect a change in capacitance with respect to ground. The coordinates of the touch are determined when a human finger introduces a change in capacitance on both row and column sensors. Since only the row and column are indentified, ghost touches result when two fingers touch the panel as shown in Figure 7. This issue only allows one touch to be detected at time with self-capacitive touchscreens [11].
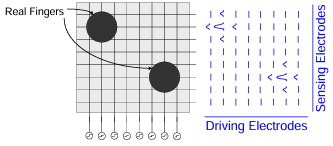
Mutual capacitive touchscreens use either the row or the column electrodes as a driver and the other set of electrodes as sensors. All of the sensor electrodes are scanned for capacitance level changes for each driver electrode. This allows for each row/column intersection to have a unique capacitance value. A finger touch is detected when the capacitance changes significantly at one or more intersections as shown in Figure 8.
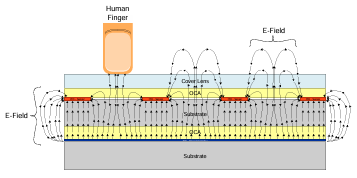
Mutual capacitance sensing is inherently immune to ghosting. This allows multiple touches to be detected simultaneously as shown in Figure 9 [12], [13].
Every row and column electrode of the touchscreen sensor panel is routed to an FPC that connects the panel to the touchscreen controller board. These electrode signals are each routed to a microcontroller pin on the controller board.
4.1.2 Touchscreen Micro controller
Touchscreen microcontrollers generally come in 8, 16, and 32-bit architectures. They are designed to perform self and/or mutual capacitive sensor scanning and generate a touch report rate of at least 100 Hz. The micro controller must provide enough I/Os for all of the sensor panel‟s electrodes. Therefore, larger sensor panels require higher I/O count microcontrollers. Other important microcontroller features include: power, communications, and data storage.
4.1.2.1 Power
Embedded capacitive touchscreen systems require analog and digital power sources. The electrodes used to drive the mutual capacitance scan use analog voltage, generally between 2.7 and 3.6 V. Communication busses use digital voltage. I2C and SPI communications generally run between 1.8 and 3.6 V. Verifying touchscreen performance at the minimum and maximum voltages for both the analog and digital rails is important. Low voltages are desired for lower power consumption; however, low voltages can degrade performance because they weaken the touch signal. Because most consumer devices run on batteries, low power consumption is an important factor; thus, most touchscreen controllers feature sleep mode. Touchscreen controllers typically draw less than 25 mW during normal operation and 10 µW in sleep mode.
4.1.2.2 Communications
In a typical end product, the touchscreen micro controller communicates with the main system processor (the host) using I2C or SPI protocol. For verification, a USB communications bridge handles the I2C or SPI packets sent and received by the touchscreen micro controller and the host PC. Touchscreen micro controllers are typically designed to perform as I2C slaves and support an I2C master speed of at least 400 kHz.
4.1.2.3 Data Storage
Touchscreen technology has advanced to the point of being able to support ten or more touches. This means a greater dependency on data storage. Each touch requires a few data bytes to record the touch coordinates and a unique identifier. Many additional touch attributes can also be stored depending on the host and the touchscreen micro controller firmware algorithms. The firmware algorithms require additional data such as panel characteristics. Panel characteristics could include the number of rows and columns (which gives the number of sensing intersections), physical dimensions, etc. It is also useful to pass the touchscreen microcontroller device information and revision to the host as well as the firmware revision. Other data may need to be stored as well depending on the micro controller.
4.2 Hardware Utilized for Verification
Systematic verification of an embedded touchscreen system requires a USB communications bridge and a Cartesian robot. Other test instruments such as arbitrary waveform generators, oscilloscopes, and power supplies may also be needed depending on the test suite.
4.2.1 USB Communications Bridge
The USB communications bridge is an essential piece of the verification system. It is the interface between the controller board and the PC containing the test management software. USB communication bridges are generally set up to supply digital and analog voltages. The bridge contains its own micro controller to support data packet handling (USB, I2C, SPI). They are provided with the touchscreen micro controller development kits.
4.2.2 Cartesian Robot
A Cartesian robot has three linear axes for the X, Y, and Z directions as demonstrated in the kinematic diagram of Figure 10. A variety of Cartesian robots exist in the market today ranging from large gantry robots to compact desktop robots. The one presented in this thesis is a desktop version. Embedded touchscreen systems are not very large; therefore, a desktop Cartesian robot is sufficient.
![Figure 10. Cartesian Robot Kinematic Diagram [35]](https://break-addiction.co.uk/wp-content/uploads/2024/03/figure-10.png)
4.2.2.1 Work Envelope
The work envelope for a Cartesian robot is rectangular as depicted in Figure 11. This shape matches the shape of a touchscreen panel and allows the unit being verified to easily line up in the available moving space The work envelope only needs to be about 400 mm X 400 mm to accommodate one or more 4.7” touchscreen panels.
A base plate must be mounted to the axis that slides along the base of the desktop robot. The base plate is used to secure the touchscreen panels during verification. The amount of space needed in the Z direction is largely dependent on the thickness of the base plate, the touchscreen panel stack-up, and the tool used to stimulate the touch panel. 100 mm provided enough room to perform the tests used in the verification system presented in this thesis.
![Figure 11. Cartesian Robot Work Envelope [34]](https://break-addiction.co.uk/wp-content/uploads/2024/03/figure-11.png)
4.2.2.2 Repeatability and Speed
Cartesian desktop robots generally provide a repeatability of about ±0.01 mm. A robot with ±0.01 mm precision is sufficient for verifying embedded touchscreen systems given that touch accuracy requirements are greater than ten times the precision (±0.1 mm). Cartesian robots typically operate at a velocity between 500 and 800 mm/s for the X and Y-axes. The time it takes to accelerate to maximum speed is a factor when testing smaller screens. In order to draw a line across the test panel at maximum speed, the robot must start at one end of the work envelope and accelerate before it touches down. The robot cannot replicate a flick type of movement, which requires a speed of about 1,000 mm/s or more. The Z-axis of this robot typically operates at a velocity of about 250 mm/s.
4.2.2.3 Payload
Cartesian robots are known for their rigid design, which allows them to handle high payloads. The axis that moves along the base can generally handle between 11 and 15 Kg of payload. This provides some leniency on the base plate needed for mounting the panels on the robot. The arm of the robot can handle 6 to 7 Kg of payload. This easily accommodates the touch object weight used for stimulating the panel.
4.2.2.4 Cost
Cartesian desktop robots with an X/Y speed of 500 mm/s cost about $16,000. Robots with higher speeds, larger work envelopes, and higher payloads are more expensive.
CHAPTER FIVE: VERIFICATION SOFTWARE
The custom-built test management software orchestrates automation of the verification system. The software is responsible for a wide range of capabilities from moving the robot to generating output of the test results. The software was carefully designed to support each of the four main test management software functions including: hardware abstraction, verification procedures, test sequences, and verification results output.
5.1 Software Architecture
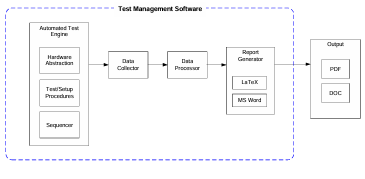
Figure 12 illustrates the custom-built test management software architecture. The automated test engine provides the framework for abstracting the hardware, procedure setup, procedure execution, and procedure sequencing. The data collector and data processor are intermediate modules required for collecting and processing the data collected during verification procedure execution. Finally, the report generator analyzes the results and displays them in human readable format.
5.2 Automated Test Engine
The automated test engine provides most of the functionality required to automate verification. It provides a way to control the various hardware devices via hardware abstraction. It executes test cases by initializing the verification system to the settings for a defined verification procedure and then executing that procedure. Finally, it provides a test sequencer to manage which tests are run and the order of execution.
5.2.1 Hardware Abstraction
Prepackaged software libraries and drivers are installed on the host PC to enable hardware abstraction for each piece of equipment including: test instruments, the USB communications bridge, and the robot.
Test instruments include arbitrary waveform generators, DMMs, and oscilloscopes. They are typically connected to the host PC via USB, GPIB, serial, ethernet, VXI, or PXI. A prepackaged VISA library for these test instruments is available for common programming languages such as C#, C++, Perl, and Python. Drivers or I/O library suites are provided by the equipment manufacturers and installed on the host PC. For example, Agilent provides “Agilent IO Libraries Suite 16” to install programming API libraries for VXI test instruments from numerous vendors.
Drivers and/or I/O development libraries are also required to communicate with the robot and touchscreen micro controller. They are provided by the hardware manufacturers. As discussed in Chapter 2, these libraries and drivers are also required for off-the-shelf test management software.
5.2.2 Procedures
When considering the need for the system under test to be initialized before each verification procedure is executed, it was necessary to have two different types of procedures for the test management software: setup and verification. The setup procedure initializes the hardware for a specific verification procedure in the test sequence. The verification procedure executes the test on the embedded capacitive touchscreen system.
5.2.2.1 Setup Procedure
The setup procedure performs device maintenance and initializes the test equipment before each verification procedure. Verification procedures may leave the device in an unknown state by design or result in a real test failure that affects the next test in the sequence. It is important for each verification procedure to perform autonomously and ensure the device and test software are in a known operating state. Power cycling and reprogramming the device and checking the connections to and initializing test equipment may be necessary between procedures in order to achieve true autonomy.
The setup procedure is separate from the verification procedure in consideration of the different hardware resources for different tests. This allows the flexibility of reusing a generic setup procedure for most test cases or developing special setup procedures for test cases requiring a unique configuration. To initialize the system under test, the setup procedure requires numerous parameters including: analog voltage, digital voltage, a firmware binary file, the communication protocol, robot specific values, and test instrument specific values. The way the parameters are defined and handled is described in Section 5.2.2.3 Test Case.
5.2.2.2 Verification Procedure
The verification procedure implements a test used to verify the touchscreen system. Some example verification procedures include measuring current in sleep mode, measuring linearity of a line drawn with a robot, and measuring signal performance of system. The next chapter will describe some tests in detail. Verification procedures may require robot and test equipment specific parameters as well as expected register values and voltage values.
5.2.2.3 Test Case
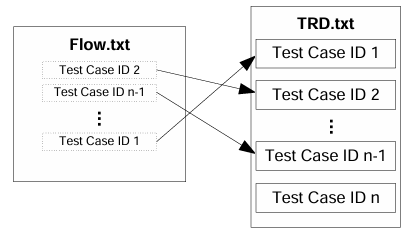
A test case consists of a unique test case ID, requirement ID, setup procedure (with parameters), and verification procedure (with parameters) as shown in Figure 13. All test cases including setup and verification procedure parameters are listed in a text file known as the Test Requirements Document (TRD).
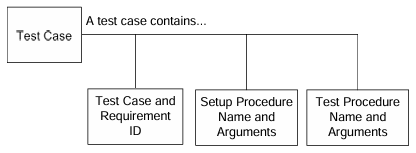
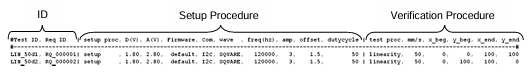
Figure 14 lists two test case line items from the TRD. The test case and requirement ID, setup procedure, and verification procedure are separated by the „|‟ character. Both test cases use the setup procedure called “setup” and set the digital voltage to 1.8 V, the analog voltage to 2.8 V, and use the default firmware communication protocol (in this case I2C). The setup procedure also uses an arbitrary waveform generator with the relevant settings of a square wave, 120 kHz frequency, amplitude of 3 V peak-to-peak, a DC voltage offset of 1.5 V, and a 50% duty cycle. Both test cases use the verification procedure called “linearity” and operate with the robot running at 50 mm/s starting and ending at the specified X and Y positions. Comparing the two test cases, the only difference between them is the diagonal line defined by the “y_beg” and “y_end” positions and their IDs.
Before executing a test case, the test case is parsed from the TRD with its associated test case unique ID, requirement ID, setup procedure, and verification procedure along with their associated arguments. The test case is then executed using the run_test_case() function. When considering the importance of logging status and results with associated timestamps, the function begins by starting the timer and enabling logging before it calls the setup procedure. The timer and logging is halted when the setup procedure finishes and restarted when the verification procedure is called.
5.2.3 Sequencer
The TRD contains all of the test cases for the system under test. The sequencer controls what tests cases are run and their order. The sequencer parses the flow file, a text file containing a list of test case unique IDs to be executed during a test run. The tests listed in the flow file are executed in order from top to bottom. During parsing, each test case instance is placed in an array and a unique instance of the setup and verification procedures is created. Figure 15 shows an example of how the flow file relates to the TRD.
After parsing the flow file, the sequencer steps through the array of test cases and executes the run_test_case() function for each test case until the full test run is complete.
5.3 Data Collector
Data is collected for each test case. Different verification procedures generate different amounts of data. Stimulating the touchscreen will create a large amount of data, while a simple data register check will only result in a few bytes. Whether the amount of data is large or small, all results are gathered by the data collector. When considering the different types of data being stored, a data object was created to distinguish between different data types and to determine a method for storage.
5.3.1 Data Object
Each setup and verification procedure instantiates a data object. A data object is used to store all of the data gathered from the test cases. Data objects enable setting and getting the data type as well as adding, setting, getting, and clearing data. The procedure sets the data type and stores the data in the structure setup for that specific data type.
5.3.1.1 Data Type
Data types are defined for each type of test case. Multiple test cases may use the same data type. The data type is set at the very beginning of a setup or verification procedure and is used by the data processor to prepare and process the data.
5.4 Data Processor
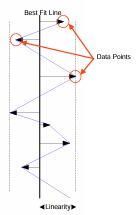
Once data has been collected and stored in the data object, it is ready for processing. Since data is stored differently for each test case type, a separate processor module is required for each data type. Processing data often involves performing calculations and generating tables and graphs. When considering the consumption of CPU resources to perform this type of processing, the data processor uses a separate thread from the automated test engine in order to maximize processing power and parallelize work. When data is captured from the robot, it is processed for a graphical view. For example, linearity test results can be displayed using a figure that compares the best-fit line (calculated from the touch data) to the actual touch data that was recorded when the touch object traversed along the touch panel. In Figure 16, the red line represents the best-fit line and the darker line represents the data points collected during the test case. Each data point is illustrated using blue circular markers (the darker, thicker line). The X and Y axes represent the physical dimensions of the touchscreen panel in millimeters. Details on the linearity test are presented in Chapter 6.
Tables are also a common way to display results data to provide a quick look at the actual data compared to the requirement and to look at pass/fail status. Utilizing one of the many open source library packages for processing data and generating tables and figures eased software development and saved time.
5.5 Report Generator
Once all of the data has been stored and processed, it is ready to be formatted into a more formalized report. The formatting options for reports are endless. When considering what format to use for file generation, it was important to support the most users; therefore, the report generator for this work automatically creates Portable
Document Files (PDF) and Microsoft Word Document files (DOC). When considering that the report generation consumes a lot of processing time, the report generator is executed using a separate thread from the data processor and the automated test engine threads in order to allow the host PC to start executing the next test case at the same time.
5.5.1 Report Object
When considering that the report being generated needed to be in a specific format, it was necessary to create a report object in order to properly lay out the pieces of the report. Once the data has finished processing, a report object is instantiated. The report object contains a report header, and one or more sections. The report header includes a title and the system configuration. The system configuration is contained in a table containing multiple system options, firmware versions, software versions, panel attributes, and other information such as the date and time. Each report section contains names, descriptions, and data such as figures and tables. Generally, a section is created to document the results for every test case. A report is ready to be generated once the report object has been populated with the processed data.
5.5.2 Document Generation
When considering the options for report format and formalization, it is important to use a tool that is widely used. The standard LaTeX document markup language was selected for this work because it is not only widely used but also provides high-quality typesetting. Report generation initially begins by generating a LaTeX file. Most LaTeX distributions include an open source tool that generates a PDF file from a LaTeX file called PDFLaTeX that has also been used successfully in other research [14]. A DOC file is generated with Windows low level APIs provided by the Component Object Model (COM) standard. An open source COM library is used to write all of the processed data to a DOC file.
When considering test runs containing hundreds of test cases, it was apparent that a way to view test results on-the-fly was necessary. Every time a report object has been populated with all of the data from a test case, the new sections are appended to the PDF report. When all tests in the test sequence have completed execution, the final PDF report is created along with the Word document.
5.6 Output
The test case output is available in forms other than the generated report. Log files and command line output are also generated. There are four different levels of logging verbosity: debug, info, warning, and error. The level of verbosity is set when executing a test run. Error verbosity level only logs information when a test fails or the setup or verification procedure is unable to perform a certain function. Warning verbosity level logs unexpected events that occur as well as all error level logging. Info verbosity level logs test status information along with what function has been entered and what is happening. Info verbosity also includes all warning level logging. Debug verbosity level logs information useful for debugging and developing new test cases and includes all info level logging.
CHAPTER SIX: CAPACITIVE TOUCHSCREEN VERIFICATION AUTOMATION
Evaluating the metrics that are most critical for touchscreen performance is a good place to start when verifying an embedded touchscreen system. Some of the most common metrics include: signal-to-noise ratio (SNR), report rate, linearity, accuracy, and jitter. Details for automating the verification procedure for each metric are presented individually.
6.1 Automating SNR Verification
SNR is an industry-standard performance metric that is particularly important in capacitive touchscreen systems. SNR is the ratio of signal (when a finger is touching the panel) to noise (when there is nothing touching the panel). SNR performance determines how easily a touch can be detected and how well the touch is reported. This is especially important when a capacitive touchscreen is the system interface. Noise enters a system in numerous ways. For example, noise is higher when a battery powered system is charging via switched-mode power supplies (SMPS). Noise levels also vary based on the type of LCD behind the sensor and the physical environment in which the device is located. In order to measure noise, the controller firmware must send raw sensor data. The raw sensor data is the digital voltage measured from the analog-to-digital converter (ADC) at a particular sensor (sensor/driver electrode intersection) without the touch object contacting the panel. The verification procedure takes a number of digital voltage samples ( ) at the panel location being verified. The noise ( ) is calculated by taking the maximum value in and subtracting the minimum value in ( ).
N =max(nNf) -min (nNf) (6.1)
The procedure then commands the robot to move the touch object onto the panel location. Once the touch object is in place, the verification procedure takes the same number of samples ( ) of signal data. The signal ( ) is calculated by subtracting the mean ( ) of the digital voltage samples collected without the touch object on the panel location from the mean of the digital voltage samples collected with the touch object on the panel location.
S = u(nf) – u(nNf) (6.2)
Although the signal represents an analog voltage, it is not typically squared for the SNR calculation because touchscreen controller applications are not as concerned with transmit/receive power as general sensors and RF applications. Power is useful for an RF circuit designer, but not useful for a touchscreen designer who writes digital algorithms. The touchscreen designer only needs a clear ratio of signal/noise to properly adjust firmware algorithm parameters and/or filter coefficients to help the overall performance of the system. SNR is the ratio of the calculated signal to the calculated noise.
SNR=s by N (6.3)
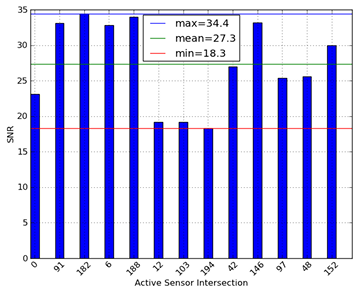
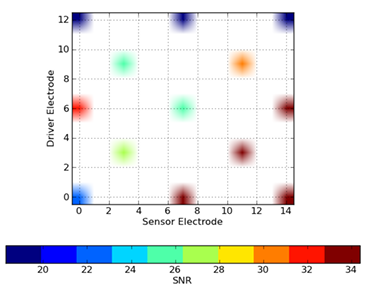
SNR measurements are taken on twelve other panel locations to get an overall picture of the SNR performance. A bar graph of the SNR calculated at each panel location is produced as shown in Figure 17. A heat map is also generated to provide a way to view the SNR data from a panel intersection location perspective as shown in
Figure 18. The auto generated report lists both figures as part of the data for the SNR verification procedure.
If the test results do not meet the system requirements, the procedure is repeated on a different system to ensure that it is a design issue. If there are no hardware defects in the panel design, the analog power supply voltage is checked. If the voltage is correct, the hardware RC filter is reviewed for possible adjustment. If the RC filter is correct, the digital filters in the firmware are evaluated. Finally, if the digital filters are correct, the resolution of the ADC and capacitance measurement time is evaluated and may need adjustment. Changing any of these can have adverse effects on other performance metrics; therefore, all other tests will need to be rerun as well.
6.2 Automating Report Rate Verification
Report rate, or refresh rate, is another common touchscreen controller performance metric. Refresh rate is the speed at which data is updated when the panel is being touched. Refresh rate is a function of scan, data processing, and sleep times. It takes a certain amount of time for the firmware to scan every driving electrode on each sensing electrode in order to detect touches. Once a scan has completed, the system must process the data received from the scan. After processing the data, the device will go to sleep for a period of time to save power. The refresh rate is the sum of the three time periods.
REFRESH = TSCAN + TPROCESS + TSLEEP (6.4)
Smaller sensor panels have fewer sensor and driver electrode intersections and therefore require less scan time. This can improve the refresh rate significantly. To understand how the refresh rate effects touchscreen performance, consider the case of drawing a curved line. A low report rate reduces the number of samples collected as a finger traverses the touchscreen and will produce a less desirable result as shown in Figure 19. A high report rate produces a much smoother curve as shown in Figure 20.
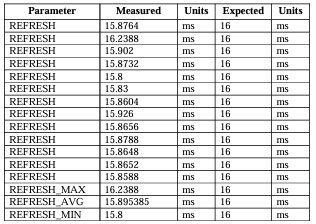
Touchscreen controllers typically use a hardware interrupt to notify the host of new data. To measure the refresh rate, an oscilloscope channel is connected to the interrupt pin. The actual refresh rate is the time measured between two interrupts. The verification procedure starts by moving the touch object to the start coordinates passed in through the TRD. Then, the scope is configured to capture multiple samples of the refresh rate. The number of samples is dependent on the distance the touch object travels. The robot moves the touch object far enough to capture at least ten samples. Once the robot has reached its final touch coordinate, the data object is updated with the results generated by the scope measurements and sent to the data processor. Data processing includes finding the minimum, maximum, and average refresh rates. A table is generated with the samples and their corresponding results as seen in Table 1. The table lists the parameters, measured value, expected value, and units. The parameter describes the type of data, whether it is a data point (e.g., REFRESH) or calculated result (e.g., REFRESH_AVG). The measured and expected values are the actual and required values respectively. The units are milliseconds.
Table 1. Refresh Rate Measurement
A failure is reported if any of the measured time periods are less than the expected time period. If the refresh rate does not meet the specification, the expected time is evaluated to make sure the size of the panel being tested is correct. If a failure is still reported, the same test is repeated on a separate system. If the failure is repeatable, the firmware has to be evaluated for ways to shorten the scanning, data processing, and/or sleep times. Sleep time can always be reduced as long as the system continues to meet the power consumption requirement. To shorten scan time, the capacitance measurement time can be reduced; however, this could affect SNR results. To reduce data processing time, the algorithms used for calculating and processing finger positions can be modified
to be more efficient. This can affect linearity, accuracy, and jitter performance and can require their associated verification procedures to be rerun.
6.3 Automating Linearity Verification
Another touchscreen controller performance metric is linearity. Linearity measures how well a finger is tracked when traversing the panel. A best-fit line is calculated using the data gathered from moving a finger linearly across the panel. The touch data is compared to the best-fit line location to determine the touch deviation as shown in Figure 21. Linearity is performed along both axes of the panel as well as across the diagonal.
The verification procedure begins by moving the robot to the first coordinate of the first line and placing the touch object on the panel. Touch data is captured as the robot traverses to the last coordinate of the line. This process is repeated for each line drawn along each axis and for each line drawn diagonally. All of the data stored in the data object and is then sent to the data processor. In order to present the data as an absolute deviation, the processor calculates the distance from the actual reported touch coordinate (Xi,Yi) to the best-fit line using the following equation:
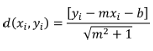
(6.5)
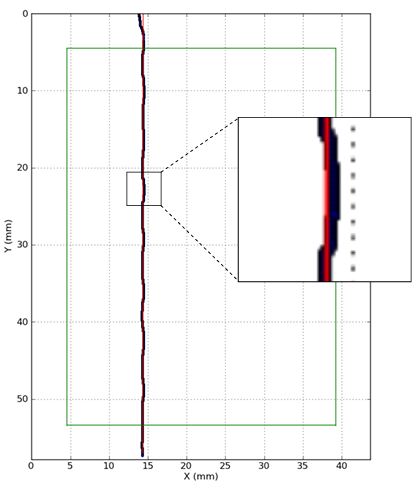
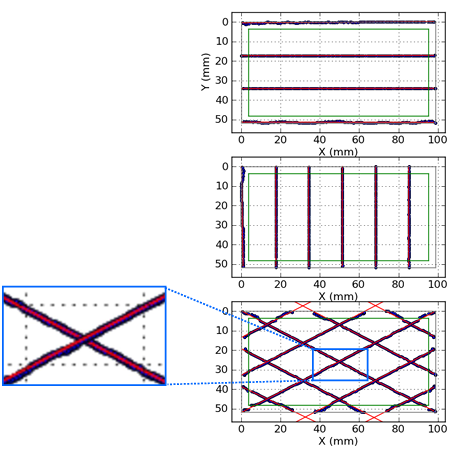
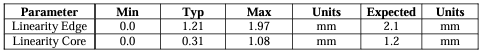
This calculation is performed for each touch report of every line. Each line traverses through the edge of the panel and core of the panel. The core is represented by the area inside of the green rectangle in Figure 22. The edge is represented by the area outside the green line. Linearity performance on the edge is typically poor compared to inside the core. Given this performance difference, the data is reported for separately for each area and the requirement is stricter for the core.
Because of the large amount of data, it is not practical to look at the linearity data for every reported touch. For a quick glance at the panel‟s performance, the minimum, typical, and maximum deviations are reported as shown in Table 2.
Table 2. Linearity Deviation Measurement
A data plot is also generated to compare the best fit lines with the drawn lines as shown in Figure 22. In the data plot, red lines show the best-fit lines and little blue circles (which appear as thicker dark lines) are the actual data points. A failure is reported when the linear deviation in either the core or edge area is greater than the requirement. When a failure is reported, the test is repeated on a separate system. If the failure is repeatable, the expected value for edge and core are evaluated with regards to the panel being tested. If the expected value is correct, the coefficients of the XY filters are examined for possible adjustments. If this does not correct the problem, the firmware and filters are analyzed and modified. If the failure is core related, the firmware algorithms and filters for core line drawing are checked. If the failure is edge related, then the algorithms and filters related to the touch reports for a line approaching the edge or drawn on the edge are checked. Changes to the filters or algorithms can affect accuracy and jitter performance and require re-verification.
6.4 Automating Accuracy Verification
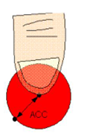
Accuracy is often confused with linearity. While the two metrics are very similar, the touch object does not traverse the panel during accuracy measurements. It touches and lifts off of a number of points on the panel and the deviation between where the touch physically occurred and where it was reported is calculated. Accuracy evaluates if a single touch is correctly reported as seen in Figure 23.
The verification procedure moves the robot to a corner of the panel, has it contact the panel with the touch object at that point, and takes one or more samples of touch data. The number of touch samples taken is passed in through the TRD. The robot then lifts the touch object off of the panel and moves to the next touch coordinate. This process is repeated for the entire panel. For each touch point, the data is copied to the data object and sent to the data processor. The data processor compares each reported coordinate (Xr,Yr) to the physical coordinate (Xp,Yp)of the robot. The comparison is done using a difference calculation for the distance error between the reported coordinate and the physical coordinate for x and y individually.
XERROR =Xr -Xp (6.6)
YERROR =Yr – Yp (6.7)
Once the error for both x and y are calculated, the total accuracy error is calculated.
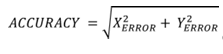
(6.8)
Much like the linearity test, the accuracy test results are better in the core than in the edge. The core is the area inside the green line and the edge is outside the green line as shown in Figure 24.
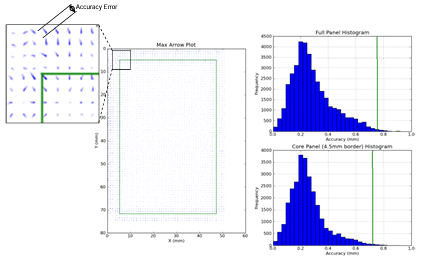
Test results for the full panel, including the edge, are separated from the core area because they have different performance requirements. The test can collect thousands of data points depending on the step size between each data point (as specified in the TRD). The minimum, typical, and maximum accuracy errors provide an overall look at the performance as shown in Table 3.
Table 3. Accuracy Error Measurement
![]()
The generated report includes two histograms and one maximum arrow plot as shown in Figure 24. The maximum arrow plot provides a full panel view of each accuracy error. The deviation is represented by an arrow at each touch point. The histograms illustrate the distribution of all accuracy error measurements. The green line
represents the requirement to be met. The frequency is the number of samples receiving a particular accuracy measurement. The top histogram is for the whole panel including the edge. The bottom histogram is for just the core area. A failure is reported if the maximum accuracy error for the edge and/or core exceeds the requirement. When a failure occurs, the expected edge and core values are checked to ensure that they are correct based on the panel type. If they are correct, the test is repeated on a separate system setup to ensure consistency. If the failure is repeatable on separate hardware, the coefficients for the accuracy and centroid filters are evaluated for possible adjustment. If the failure persists, the firmware algorithms related to finger centroids are evaluated and adjusted. The filters and firmware algorithms are adjusted differently for edge and core specific failures.
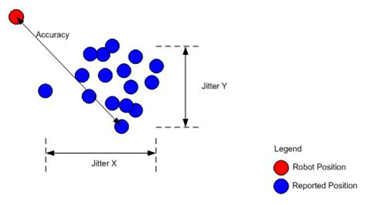
6.5 Automating Jitter Verification
Jitter is closely related to accuracy. During a jitter test, the touch object remains stationary on the panel for a significant amount of time (as specified in the TRD) and the deviation between touch reports during the touch period is calculated. Jitter is two dimensional; therefore, the deviation distance is measured for both the X and Y axes as shown in Figure 25.
The verification procedure starts by moving the robot to a spot on the panel and placing the touch object on the spot. The robot holds the touch object stationary while capturing multiple data samples. The robot then lifts the touch object and moves to another panel coordinate. The process is repeated for twelve other locations similar to those used during SNR verification. Once the robot has completed the last touch coordinate, the data object is updated with the results and sent to the data processor. Data processing involves taking the collection of samples from each touch position and calculating the X distance ( ) and the Y distance ( ) between the two extreme touch reports.
JITTER x = max ( X1..n) -min (x1..n) (6.9)
JITTER y =max (Y1..n)-min(y1..n) (6.10)
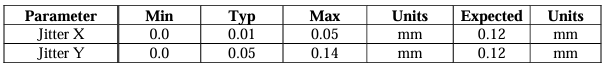
The overall results are reported in a table similar to Linearity and Accuracy as shown in Table 4. Jitter deviation data is much better than the accuracy data because jitter is similar to resolution. Resolution is a much smaller measurement than an accuracy measurement. A touchscreen with 0.1 mm jitter and 0.8 mm accuracy means the accuracy reading can be between 0.7 mm to 0.8 mm due to jitter performance.
Table 4. Jitter X and Y Measurement
The data is also displayed in a panel-oriented view, as shown in the 3D bar graph at the top of Figure 26. Jitter measurements are represented on the Z axis in mm and physical locations on the panel are represented on the X and Y axes. The bottom bar graph allows for a more accurate comparison of the jitter measurements at their corresponding touch position.
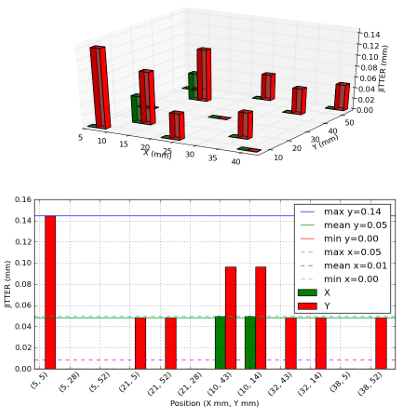
A failure is reported when the maximum jitter value from any of the thirteen locations exceeds the requirement. If a failure occurs, the test is repeated on a separate system setup to ensure that the issue is design related. If it is a design issue, the firmware algorithm used to determine whether a new coordinate should be reported is evaluated. If the system continues to fail, the jitter filtering coefficients are evaluated for possible adjustments. If this does not resolve the issue, the centroiding algorithm is analyzed for possible improvements. If the centroiding algorithms are modified, the accuracy and linearity tests need to be rerun.
CHAPTER SEVEN: CONCLUSIONS
It is critical to use a systematic approach when verifying embedded capacitive touchscreen systems due to their complexity and the rigorous demands placed on these systems. In order to create a repeatable process, it is important to select an appropriate robot as well as a flexible test software platform. A Cartesian style robot and custom built test management software work together to provide a systematic and repeatable verification solution.
7.1 Robot
Many factors were considered during robot selection. SCARA and Cartesian robots both have advantages and disadvantages as discussed in this thesis. The Cartesian robot‟s rectilinear work envelope made it a natural fit for working on touchscreen panels. Its work envelope was large enough to verify multiple touchscreen systems at once, reducing setup time. The SCARA robot‟s circular work envelope does not naturally lend itself to working with multiple rectangular touchscreen panels. Payload was perhaps the most important reason for choosing the Cartesian robot. The Cartesian robot can handle about seven times the amount of payload of the SCARA robot. Higher payloads allow the robot to heft heavier touch objects. This makes the verification system more flexible. Payload also impacts the robot‟s acceleration and maximum speed. In order for either robot to reach its maximum speed, the payload can only be one third to one half of the maximum supported. The SCARA robot has a speed advantage; it can move about six times faster than a Cartesian robot on the XY plane. This speed would enable the verification system to simulate fast finger movements. The Cartesian robot is also little more cost effective than the SCARA.
7.2 Test Management Software
The test management software is the engine for automation. Both of the solutions mentioned in this thesis can automate embedded capacitive touchscreen system verification. Each one has a different set of advantages and disadvantages. Abstracting hardware is done similarly with both solutions. TestStand allows verification procedures to be written in any language. This makes the solution more flexible when implementing test procedures. Existing software modules written in different languages can be leveraged. It also means that the person performing verification procedure maintenance would have to be familiar with all of the languages, which could prove problematic. Report generation is different for both. TestStand supports ASCII text and/or markup languages including HTML, XML, and ATML. These formats allow the reports to easily be viewed in an internet browser. TestStand also supports saving results in a database. The custom-built solution does not support this type of report generation. It generates a LaTeX, PDF, and Microsoft Word documents, which are also standard and easy to use.
Flexibility is the main differentiator between the two test management software solutions. The off-the-shelf solution comes as a pre-built package that doesn‟t allow for internal enhancements, which limits what it can do. For example, TestStand cannot provide the output in a PDF format. A separate external software module must be developed to take TestStand‟s ASCII text and create a PDF document. Adding and modifying functions is easy with custom-built test management software.
A report generator module can be developed to generate HTML output. The off-the-shelf software also includes features that are not necessary for this type of application and require additional computer resources. The custom-built solution only implements the features that are required for verifying an embedded touchscreen system. Finally, the custom-built solution can be more cost-effective depending on development time and the how often the software is executed. TestStand costs approximately $4,000 per license and can increase to $9,000 if additional verification procedures must be developed using NI‟s LabView [21]. Additional licenses, support, and software upgrades also add cost.
CHAPTER EIGHT: FUTURE WORK
Improvements can be made to both of the main components of the automated verification system described in this thesis. For the robot, touch object solutions for panel stimulation can be researched. For the test management software, more report generation options and database output can be added. Further work can also be done on accurately emulating a human experience with the device during the verification process.
8.1 Robot Touch Objects
Panel stimuli come in many forms and sizes. A touch object can be anything that introduces significant change in capacitance at a given location. There have been reports of people even using sausages or hot dogs as a stylus in cold weather, enabling them to use the touch screen while keeping their gloves on [22]. It is very important to know the system requirements before selecting the touch objects used for verification. Understanding the appropriate size, shape, and capacitance requirements is critical for ensuring that the verification process uses the right touch objects. Developing an automated solution for changing the form or size of the touch object without changing touch objects would be very beneficial. Using the same touch object would increase the amount test coverage, reduce test time, and better utilize robot resources.
8.2 Test Management Report Generation
The test management software created for this thesis can generate reports as a PDF file and a DOC file. This meets the requirements of most verification test systems; however, other report file types would be useful. Postscript, spreadsheets, and presentations could all be developed depending on the needs of the people reviewing the results. Web browsers are widely used to access information, and utilizing a web browser to view test results can be very practical. Adding HTML documentation support would allow the results to be available online to anyone without requiring them to download a file or a software tool. It would also make it simple to access results from previous test runs.
8.3 Test Management Software Database Support
Adding database support would make test results more organized and readily accessible. It will enable post test run results analysis. Programming libraries are available for ODBC and ADO to provide this support. Supporting databases using ODBC has its challenges [19], but it would be worth the effort. This type of support is available in Test Stand as described in Section 2.2.1 TestStand Test Management Software. It provides interfacing support to multiple databases including MySQL, SQL Server, Access, Oracle, and Sybase.
8.4 Human Experience
Automation is essential for repeatedly and systematically verifying embedded capacitive touchscreen systems; however, the ultimate judge of how well a device works is the human user. This fact makes verifying this type of system very complicated. Each person has a unique set of expectations and when combined with their previous experience using a touchscreen device, they can have very different experiences with the device. Most new defects are found when performing a manual task. “It is not the repetition but the development of an automated test and its initial execution that reveals most defects.” [23] One way to minimize this issue is to develop tests that are comparable to human experiences. This includes designing verification procedures that use movements with great variability, much like natural human movement. The procedures can be designed using sample data from a large group of people. Data analysis can determine an average sample and then a verification procedure can repeat the sample data.
This method can be applied to a set of common finger movements. Another challenge is the fact that every human being introduces a slightly different amount of capacitance change. This causes the touch signal to vary, which causes the touch trace result to vary significantly between different people. To help account for this variation, a circuit that simulates the amount of capacitance that an average human body introduces could be added between the robot finger and ground. ANSI/ESDA/JEDEC joint standard uses about 1,500 resister to simulate the human body model (HBM) with ESD [20].
Even with the suggestions mentioned above, there will be users that have characteristics outside the range of the verification tests. Some manual verification will be required. In spite of this fact, automating as much of the verification process as possible will greatly reduce the time required to manually run verification procedures.
REFERENCES
[1] Alan C. Kay, “A Personal Computer for Children of All Ages”, In Proceedings of the ACM National Conference, Boston, MA, Aug 1972. [2] Alan C. Kay, Charles (Chuck) Thacker, Mary Lou Jepsen, and Steve Hamm, “The 40th Anniversay of the Dynabook, lecture by Alan Kay et al.”, Computer History Museum, Mountain View, CA, Nov 2008http://www.computerhistory.org/collections/accession/102695307 [3] “The History of the Xerox Alto”. Carl J. Clement. March, 2002. [4] http://www-03.ibm.com/ibm/history/exhibits/pc/pc_1.html [5]http://www.displaysearch.com/cps/rde/xchg/displaysearch/hs.xsl/120423_touch_sensor_capacity_forecast_to_reach_16.4_million_square_meters_in_2014 [6] http://www.ni.com/pdf/features/us/teststand3_feature_matrix.pdf [7] IVI Foundation, “IVI Driver Architecture”, http://www.ivifoundation.org/about/architecture.aspx [8] S. Delgado, A. Jain, “ATML as a framework for reducing development time and maintenance of next generation test systems”, Conference: AUTOTESTCON, International Automatic Testing Conference – AUTEST, pp. 174-177, 2007. [9] A. K. Kulkarni, T. Lim, M. Khan, K. H. Schulz, “Electrical, optical, and structural properties of indium-tin-oxide thin films deposited on polyethylene terephthalate substrates by rf sputtering”, Journal of Vacuum Science & Technology A: Vacuum, Surfaces, and Films, Volume 16, Issue 3, Feb. 1998. [10] N. Al-Dehoudi, M.A. Aegerter, “Wet Coating Deposition of ITO Coatings on Plastic Substrates”, Journal of Sol-Gel Science and Technology, Volume 26, Issue 1-3, pp 693-697, Jan. 2003. [11] H. R. Kim, Y. K. Choi, S. H. Byun, S. W. Kim, K. Choi, H. Y. Ahn, J. K. Park, D. Y. Lee, Z. Y. Wu, H. D. Kwon, Y. Y. Choi, C. J. Lee, H. H. Cho, J. S. Yu, M. Lee, “A mobile-display-driver IC embedding a capacitive-touch-screen controller system,” Solid-State Circuits Conference Digest of Technical Papers (ISSCC), 2010 IEEE International , pp.114 – 115, Feb. 2010. [12] T. H. Hwang; W. H. Cui; I.-S. Yang; O. K. Kwon, “A highly area-efficient controller for capacitive touch screen panel systems,” Consumer Electronics, IEEE Transactions on , Vol. 56, No.2, pp.1115 – 1122, May 2010. [13] G. Barrett, R. Omote, “Projected-Capacitive Touch Technology,” Information Display, Vol. 26, No. 3, March 2010, pp 16-21. [14] K. Hoppner, “Strategies for including graphics in LaTeX documents”, In Proceedings of the Practical TeX Conference, Volume 26, No. 1, June 2005, pp 59-62 [15] K.Li, M. Wu, “Effective Software Test Automation: Developing an Automated Software Testing Tool,” Alameda, CA; Sybex Inc., 2004. [16] J. H. Lim, S. H. Song, J. R. Son, T. Y. Kuc, H. S. Park, H. S. Kim, “An Automated Test Method for Robot Platform and Its Components,” International Journal of Software Engineering and Its Applications, Vol. 4 No. 3, pp. 9-18, July 2010. [17] A. Mette, J. Hass, “Testing Processes,” Software Testing Verification and Validation Workshop, ICSTW‟08, IEEE International Conference on. IEEE, 2008. [18] T. R. Coffman, “A Framework for Automated System Testing,” Thesis, Massachusetts Institute of Technology, 1996 [19] H. Abdalhakim, “Addressing Burdens of Open Database Connectivity Standards on the Users,” Intelligent Information Technology Application Workshops (IITAW), Third International Symposium, Nov. 2009. [20] “JS-001-2012”, ANSI/ESDA/JEDEC Joint Standard for Electrostatic Discharge Sensitivity Testing – Human Body Model (HBM) – Component Level, April 2012. [21] http://www.ni.com/products/teststand/ [22] http://www.engadget.com/2010/02/11/south-korean-iphone-users-turn-to sausages-as-a-cold-weather-me/ [23] S. Berner, R. Weber, R. K. Keller, “Observations and Lessons Learned from Automated Testing,” In Proceedings of the 27th International Conference on Software Engineering. pp. 571 – 579, ACM, 2005. [24] X. He, “Embedded Systems Based Modular Test Automation,” Computing Communication, Control, and Management, 2009. CCCM 2009. ISECS International Colloquium on. Vol. 4 pp. 83-86. IEEE, 2009. [25] S. Jovalekic, B. Rist, “Test Automation of Distributed Embedded Systems Based on Test Object Structure Information,” In Electrical and Electronics Engineers in Israel, 2008. IEEE 2008. IEEE 25th Convention of, IEEE, pp. 343-347, 2008. [26] C. Xu, Z. Zhao, F. Wang, K. Xu, “General Automation Test System Based on the Cooperation of Software and Hardware,” In Control and Automation, 2009. ICCA 2009. IEEE International Conference on, pp. 797-800. IEEE, 2009. [27] M. D. Nes , J. S. , V. V. C , I. M. Salom, “An Automated Hardware Testing Using PXI Hardware and LabVIEW Software,” In Circuits and Systems for Communications (ECCSC), 2010 5th European Conference on, pp. 232-235. IEEE, 2010. [28] E. Siegel, “Introduction to Capacitive Touchscreen Controllers,” Phoenix, AZ. 2008. [29] M. Bhalla, A. Bhalla, “Comparitive Study of Various Touchscreen Technologies,” International Journal of Computer Applications, Vol. 6, No. 8, 2010. [30] J. Winters, “Touchscreen Alternative,” Mechanical Engineering, New York, NY. (0025-6501), Vol. 133, Issue 6, pp. 25, June 2011 [31] D. S. Hecht, D. Thomas, L. Hu, C. Ladous, T. Lam, Y. Park, G. Irvin, P. Drzaic, “Carbon Nanotube Film on Plastic as Transparent Electrode for Resistive Touch Screens,” Journal of Society for Information Display, Vol. 17 Issue 11. pp. 941 946. 2009 [32] http://prime.jsc.nasa.gov/ROV/images/cartesian.GIF [33] http://en.wikipedia.org/wiki/File:Descartes_configuration.png [34] http://i01.i.aliimg.com/photo/v0/684846143/8_MID_digitizer_touch_screen.jpg [35] http://www.salt.com.tw/Download/Document/PCI/PenMount%201201%20Contr ol % 20 Board% 20 Data%20Sheet%20V1.03.pdf
[36] http://img.directindustry.com/images_di/photo-m/multiple-purpose-cartesian robot-21823-2710715.jpg [37] http://www.cypress.com/fckimages/CY3295-MTK_img02.jpg [38] http://www.wavecom.com.au/03_product_images/719/AFG3021B.jpg
[39] http://www.staubli.com/typo3temp/pics/fc80d1fa9a.jpg
[40] http://www.intelligentactuator.com/images/scaracoor.jpg
[41] https://commons.wikimedia.org/wiki/File:SCARA_configuration.png